Is this blocked in my department: 2021 year in review
Spotify Wrapped but for “can I actually use this website at work?”
Another year has gone by, and it’s been a weird one. The pandemic is still very much happening, and most federal public servants are still working from home.
Using online collaboration tools has been a big part of making it possible to work from home. That’s a big change for Government of Canada departments, who have historically been very reluctant to allow access to these tools. Since 2019, I’ve tracked where online services are allowed or blocked at Is this blocked in my department.ca, with a set of anonymous submission forms that let people report which sites they can access in each department.
Below is the 2021 “Is this blocked in my department” year in review; you can read the 2020 year in review here.
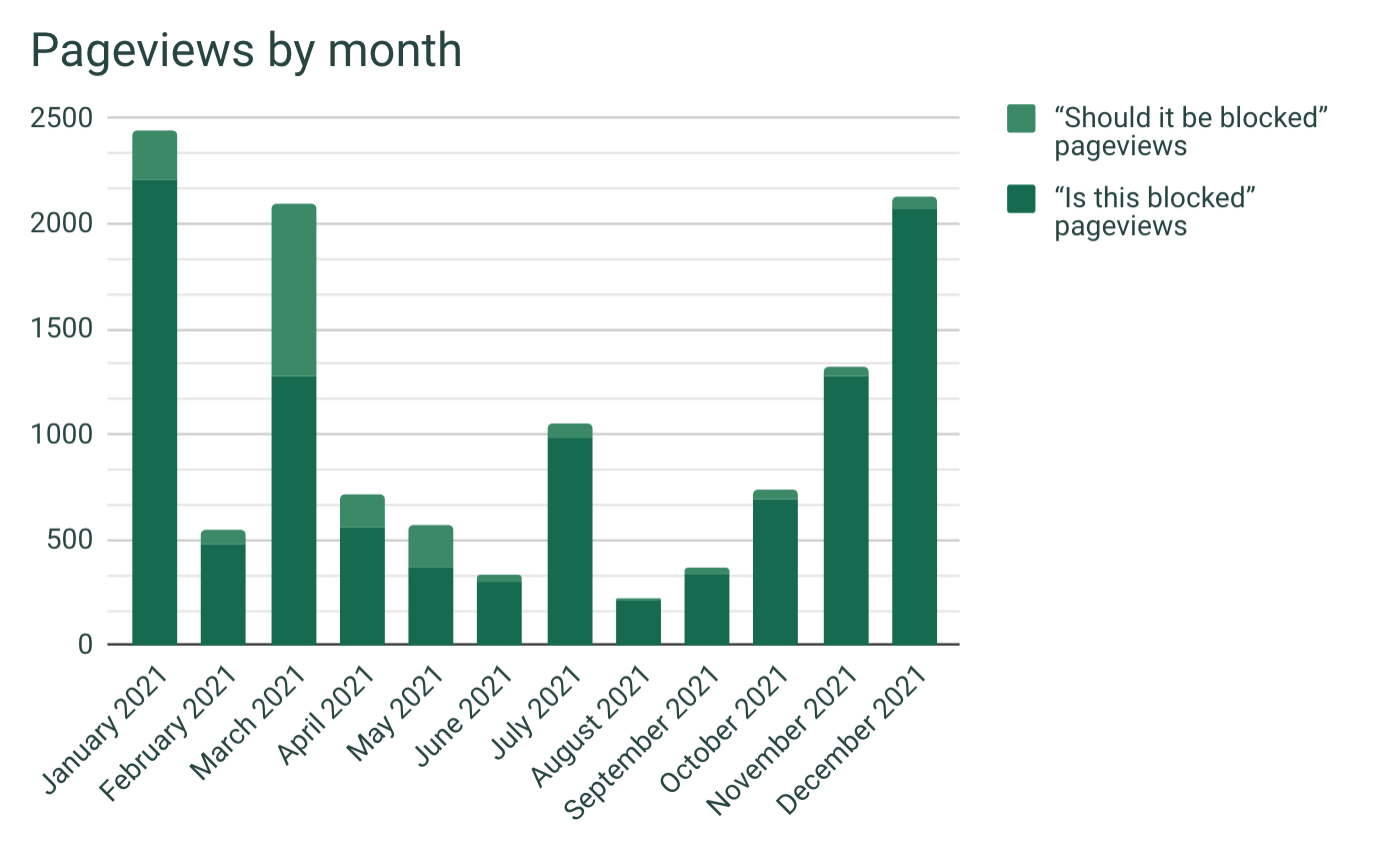
Traffic by month
Like last year, traffic to the website varied quite a bit from month to month based on social media coverage. In 2021, “Is this blocked” had 10,600 pageviews, compared to 11,500 in 2020. Similarly, the “Should it be blocked in my department” companion site had 1,800 pageviews in 2021 compared to 2,000 pageviews in 2020.
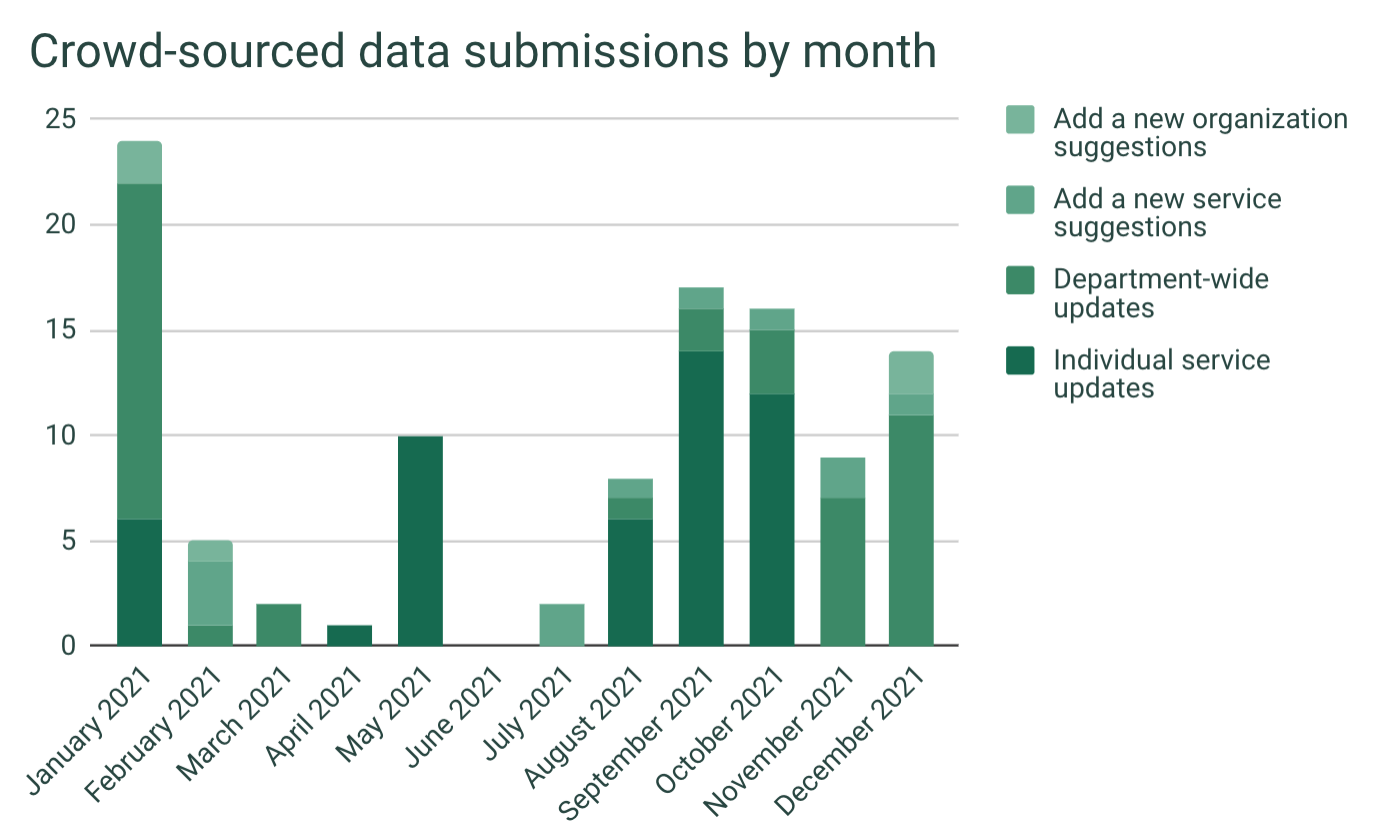
Submissions by month
Data for each department is submitted anonymously by public servants, using one of the four suggestion forms. In 2021, people sent in 108 suggested updates, more than the 72 updates sent in in 2020.
This included 11 suggestions for new services, and 5 suggestions to add new departments and agencies.
All five of these organizations have now been added; if you sent in a request to add a new department, be sure to come back and send in an update on which services are available or blocked in that department!
Submissions by department
Not counting suggestions to add a new service or to add a new organization, there were 92 suggested updates to data for specific departments.
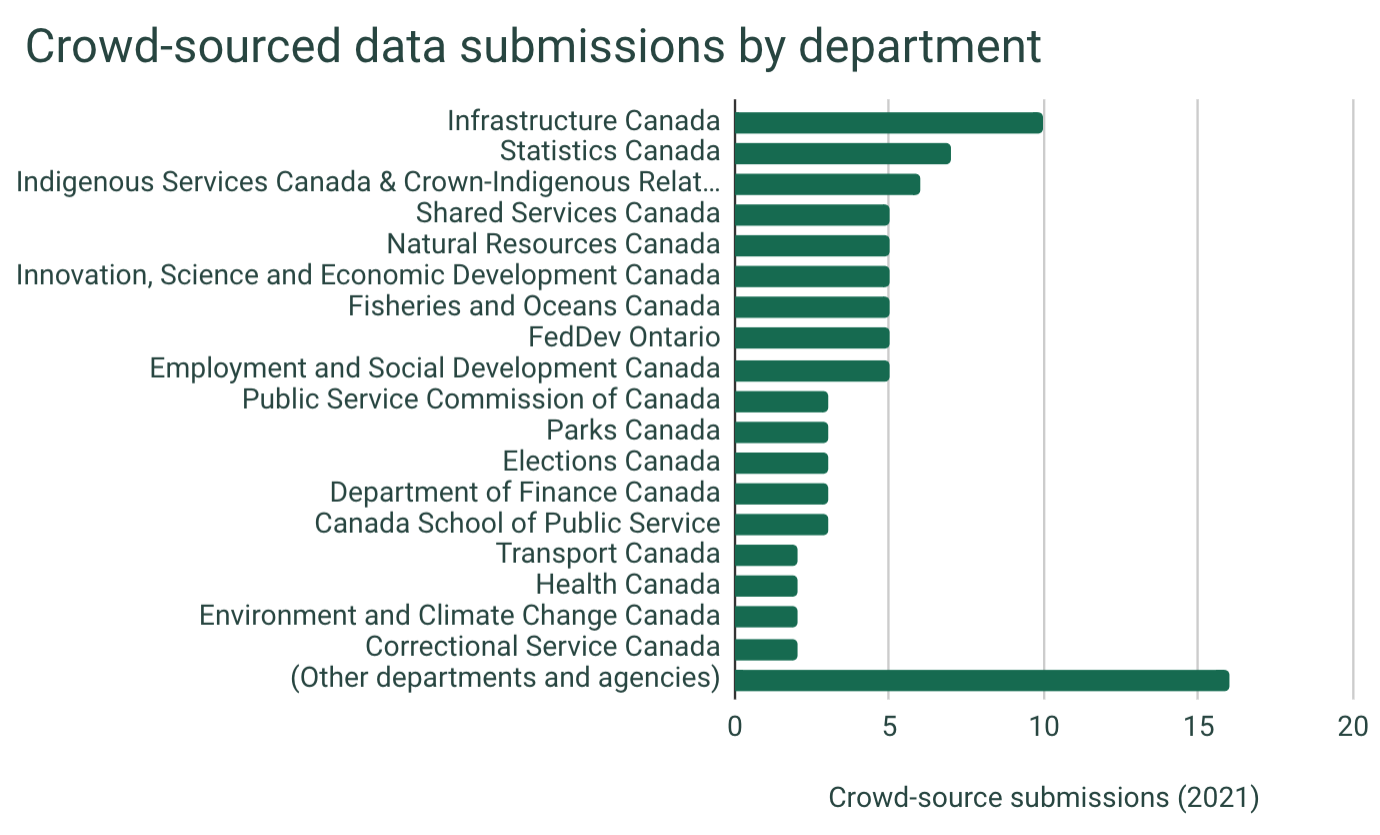
The quality of the data gets better the more submissions are sent in. Big thanks to everyone who contributed updates in 2021!
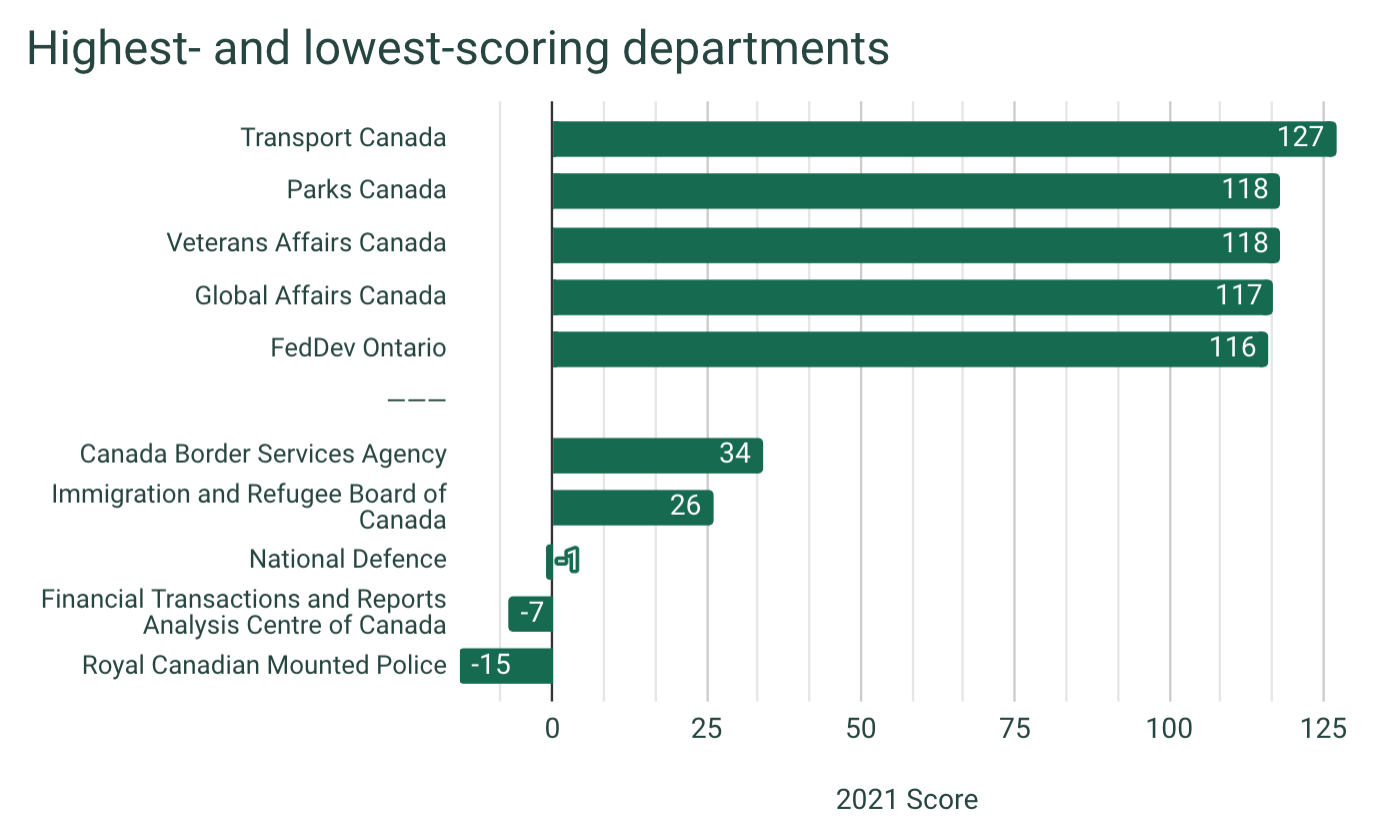
Highest- and lowest-scoring departments
As new services were added to the dataset, the highest possible score (for 100% services open by default) increased from 114 last year to 129 this year.
Transport Canada retained its 2020 title, as the highest-scoring department in 2021 as well. Congrats to everyone at TC who worked on opening up access to modern tools in the department! Parks Canada moved from third place last year to second place this year, while Veterans Affairs Canada and Global Affairs Canada moved up into the top rankings.
Several departments tied for fifth-highest place: FedDev Ontario; Innovation, Science and Economic Development Canada; Indigenous Services Canada & Crown-Indigenous Relations and Northern Affairs Canada.
Not surprisingly, security-related departments and agencies tended to have the lowest scores, with the Royal Canadian Mounted Police likewise retaining its last-place finish from last year:
Most- and least-improved departments
One of my favourite categories from last year’s analysis was looking at which departments and agencies improved the most (or least) since the previous year.
The five most-improved and five least-improved departments in 2021 are shown below; the number overlaid on each row is the positive or negative score change since last year. (Specifically between the Dec. 8, 2020 update and the most recent update from Dec. 26, 2021.)
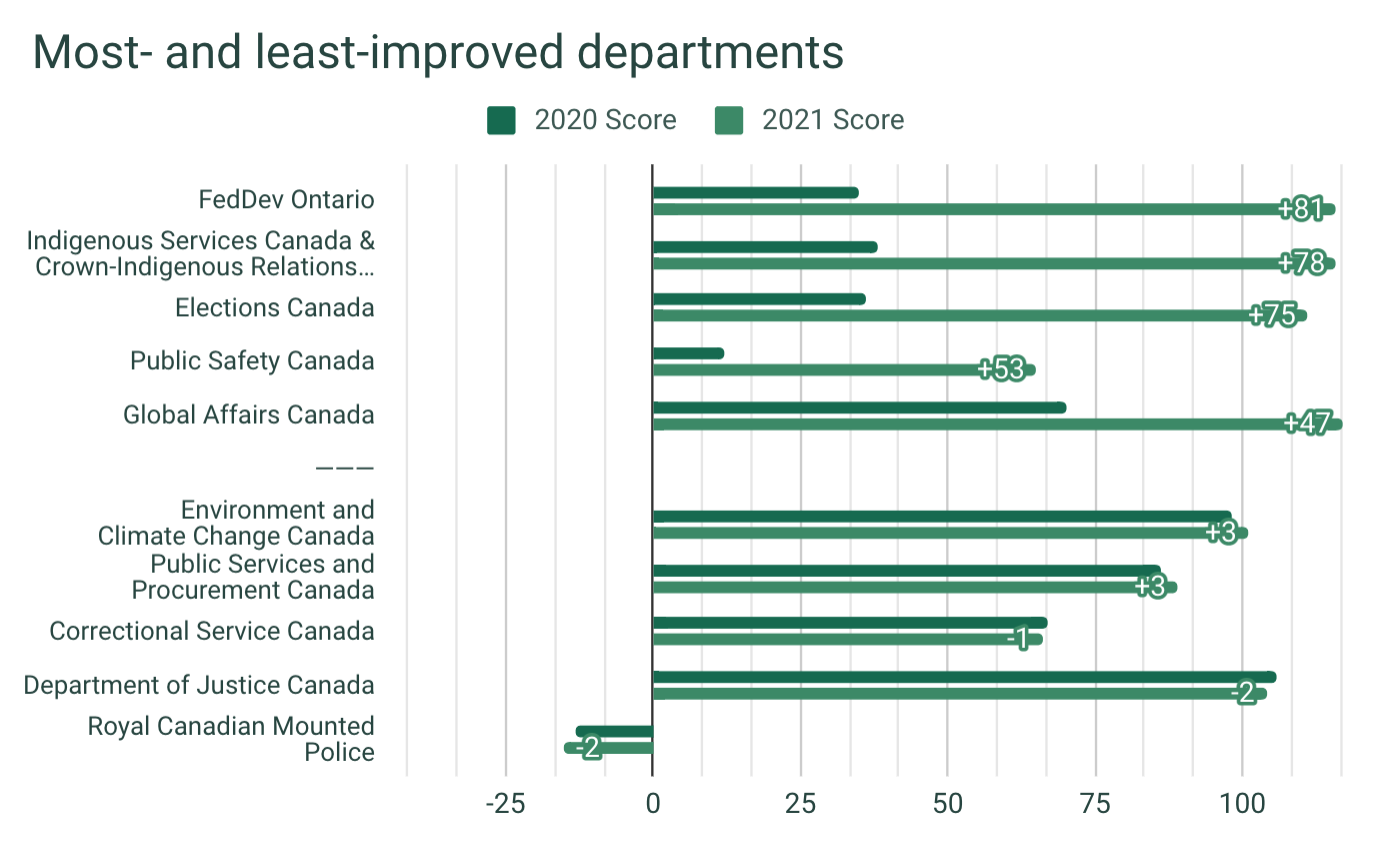
Three departments had overall lower scores than last year: Correctional Service Canada; Department of Justice Canada; and the Royal Canadian Mounted Police.
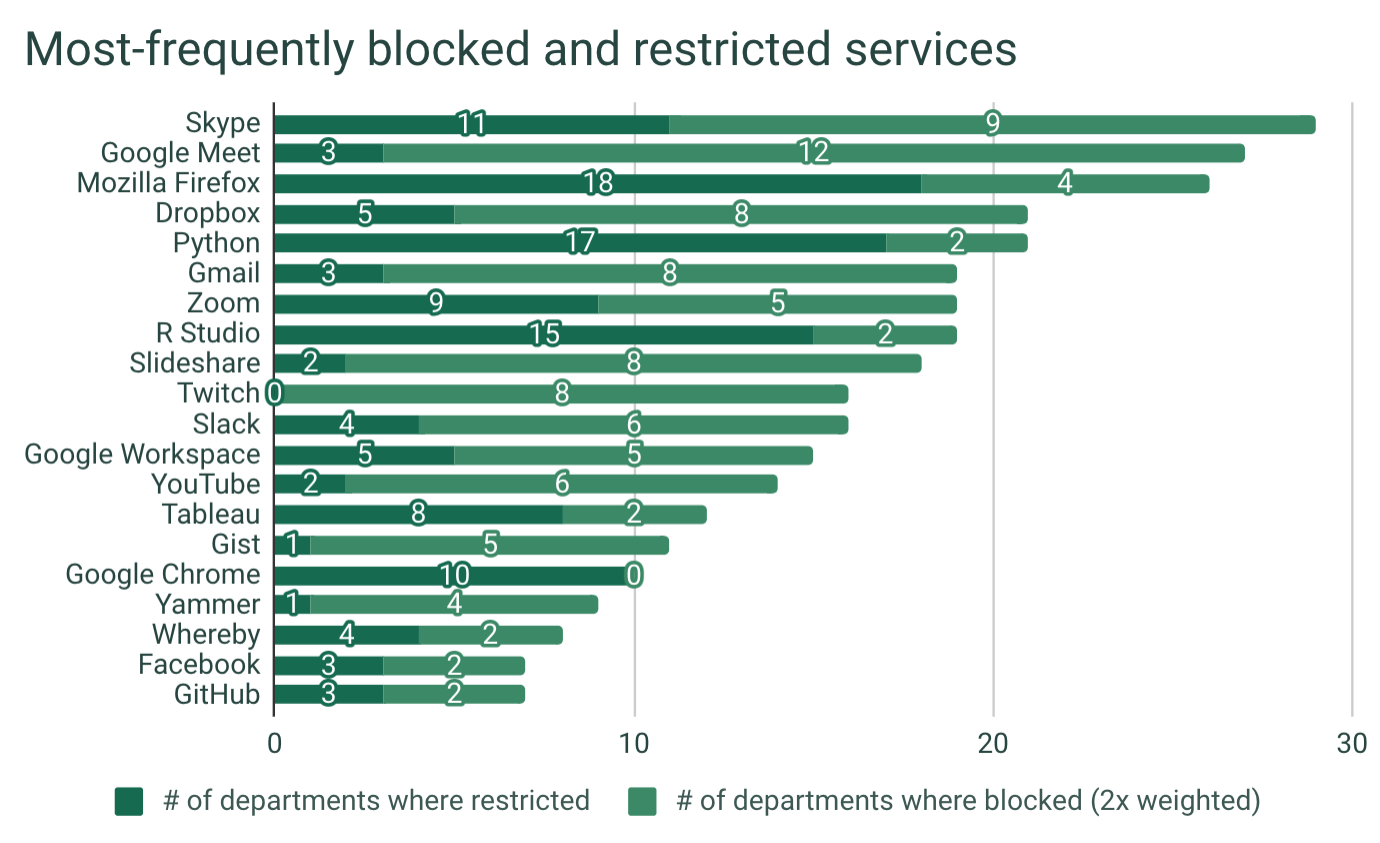
Most-frequently blocked and restricted services
New this year is a look at which online tools and services are the most likely to be blocked in departments. The top twenty most-frequently blocked and restricted services are shown below.
Although the main focus of “Is this blocked” is online services accessed through a web browser, installed software programs are also critical to the work of public servants. These programs show up fairly highly in the list of most-blocked services: Skype for videoconferencing, Python and R Studio for data analysis, and the Mozilla Firefox and Google Chrome web browsers.
The online services in the most-blocked list cover a wide range of use-cases, from videoconferencing to social media to document sharing and team collaboration. Over time, I hope this list gets smaller and smaller.
Services that are marked as “restricted” in the data set include cases where only specific staff in a department can access the service (for example, only comms staff being able to access social media websites, or only IT staff being able to use data analysis tools).
If there are several submissions from the same department that disagree, within a similar timespan, the “restricted” category is also used as a tie-breaker, since this situation usually indicates that access to the service is uneven across the department. “Restricted” is also used if staff need to request permission to access a service (for example by sending in an IT service ticket), rather than it being available by default.
“Blocked” – where services aren’t available within a department at all, even when staff ask for them – is weighted twice as heavily as “restricted” in the chart above, since this situation is the most likely to significantly hamper public servants’ work.
If you’re in an IT management, desktop services, or leadership role in a department, you should think seriously about making each of these services open by default. Reducing barriers to using modern tools makes public servants more capable, more effective, and more productive. Not to mention: happier, and more likely to want to work in your department!
To 2022!
I’m always thrilled to see new updates come in to Is this blocked in my department. If you’ve sent in suggestions over the past year, thanks so much for having made the site better!
As always, if you see any errors or missing entries on the site, please send in your suggestions! If you have other thoughts or feedback, you can email isthisblockedinmydepartment@gmail.com or give me a shout on Twitter.
Please stay safe and healthy – happy new year to you and yours!