How much does the Canadian government spend on IT contracts each year?
Or on professional services, or on facilities, or on defence? Introducing govcanadacontracts.ca
(The answer is: about $4.6 billion dollars in the most recent fiscal year.)
This week I’m coming up to the end of my Public Servant-in-Residence term at Carleton University. It’s been an absolute dream to work with Prof. Amanda Clarke and the School of Public Policy and Administration.
A key focus of our research work over the past few months has been analyzing Government of Canada procurement contracts as a way of exploring how the federal government spends money on information technology. Conveniently, contracts for IT – and every other area of government purchasing – are listed in a comprehensive open data set published on open.canada.ca. It is a fascinating resource, and I’m a huge fan of the open government team at TBS that maintains this data.
As is often the case with government datasets – this information is publicly available (and you can even search through it, contract by contract!) – but it can be hard to get an overall understanding of what the data looks like at a government-wide level. That’s particularly true in this case, with 925,000 entries in a 400MB CSV file. Excel doesn’t cut it, as the saying goes.
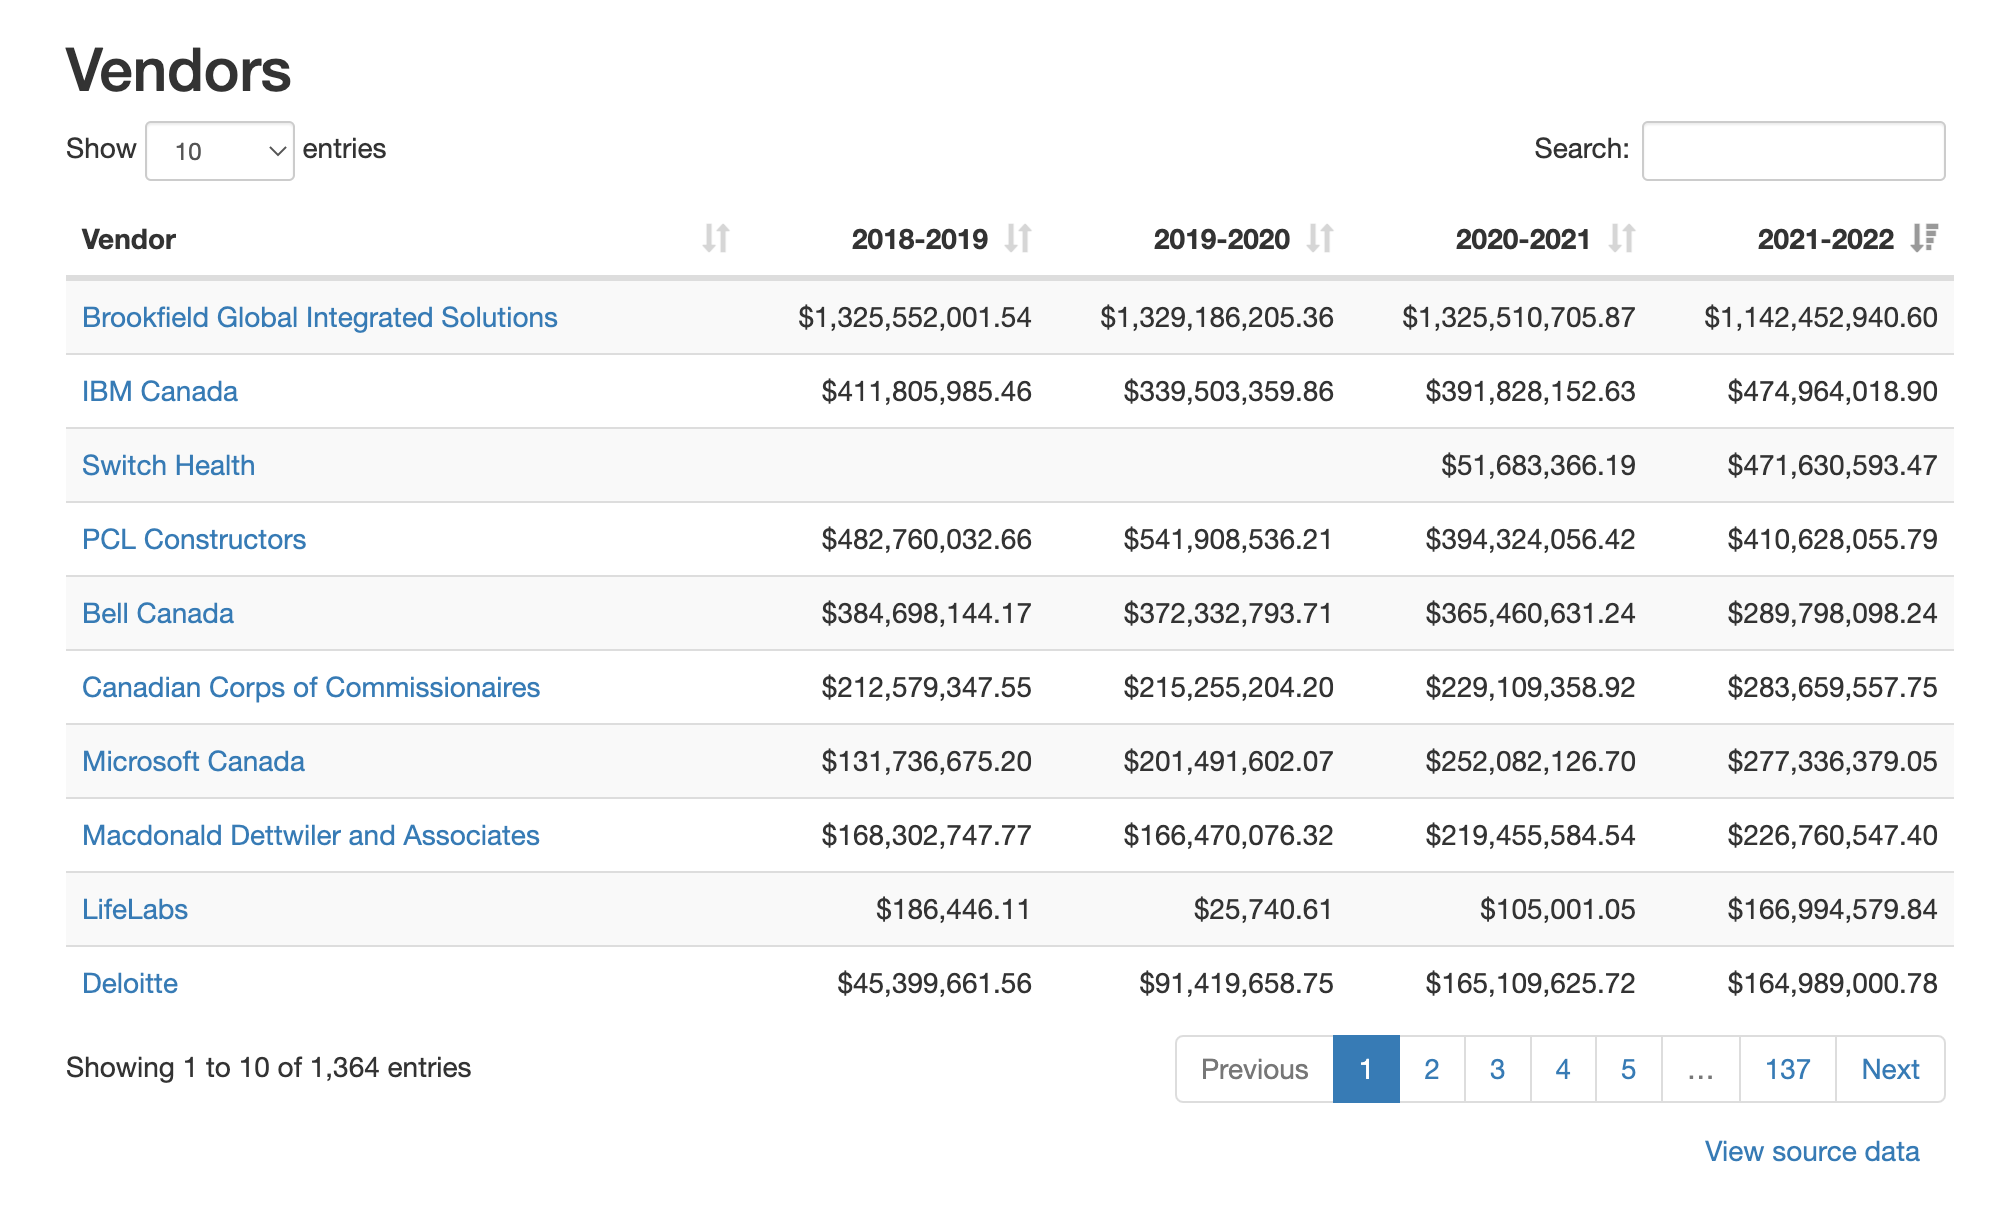
To make it easier to understand government contract spending at scale, our team is really excited to launch govcanadacontracts.ca, a research website that breaks down this data by vendor, by department, by category, and overall across government. You can explore trends over the past few fiscal years across each of these dimensions, and use the links to jump from department to vendor to category and back – as well as look up the original source data for each vendor’s contracts with links back to the entries on open.canada.ca.
You can learn more about how the data was analyzed and how the website was built on the Methodology page. This research expands on earlier work that some of you might remember from Ottawa Civic Tech – it’s been really wonderful to be able to revisit this from an academic standpoint. And to conduct the analysis in R, not, uh, PHP. (Long story!)
Check out the website, explore the data from your favourite government departments and contractors, and let us know what you think! If you see issues or errors, or if you have suggestions for data visualizations, website improvements, or future research, we’d love to hear from you.
I’m super grateful to Prof. Amanda Clarke, and to Anne Lajoie and Chantal Brousseau from our research team. We’ll have more to share in the weeks ahead from our research findings – stay tuned! Amanda and I will also be at FWD50 this year talking about our work and what the data tells us about the state of IT contracting in Canada – hope you can join!
Lastly: this kind of research would not be possible without all the work of R package developers and data science educators. You are all genuinely above and beyond – thank you. ❤️ Fellow Government of Canada folks: modern data science isn’t possible without the Tidyverse (or Anaconda, the Python equivalent). If it’s not available on your work computers, it should be. It is a wild and surreal set of game-changing data science tools, and a phenomenal community of practitioners.