Is this blocked in my department: a year in review
Update: This is the 2020 “Is this blocked in my department” year in review. Read the 2021 year in review here.
In my post last week I talked about how access to tools – online services, software, and modern computers – will affect where public servants choose to work. Given a choice of organizations to work at, talented public servants are going to choose the departments and agencies that provide them with the best enabling environment.
Over the past year, public servants across Canada adapted to working through the pandemic. Departments made a lot of progress in improving access to online collaboration tools and other services. But, there’s still a pretty dramatic gap between departments – the working environment for public servants in more restrictive departments is very different from that of their colleagues in more forward-looking departments.
One of the civic tech projects that I’ve maintained for a few years – Is this blocked in my department? – is an effort to track that gap. It’s a crowd-sourced website where public servants can anonymously document the online services and other tools that they can or can’t access within their department. I built it in 2018 as an Ottawa Civic Tech project, and soft-launched it around this time in 2019. Seeing data come in over the past couple years as people make suggestions has really been a highlight.
When the pandemic started, friends and colleagues across the federal public service began using it to figure out which of their counterparts in other departments they could communicate with, with which online services. Below is a quick look back at 2020 based on statistics from Is this blocked in my department. Happy new year, everyone!
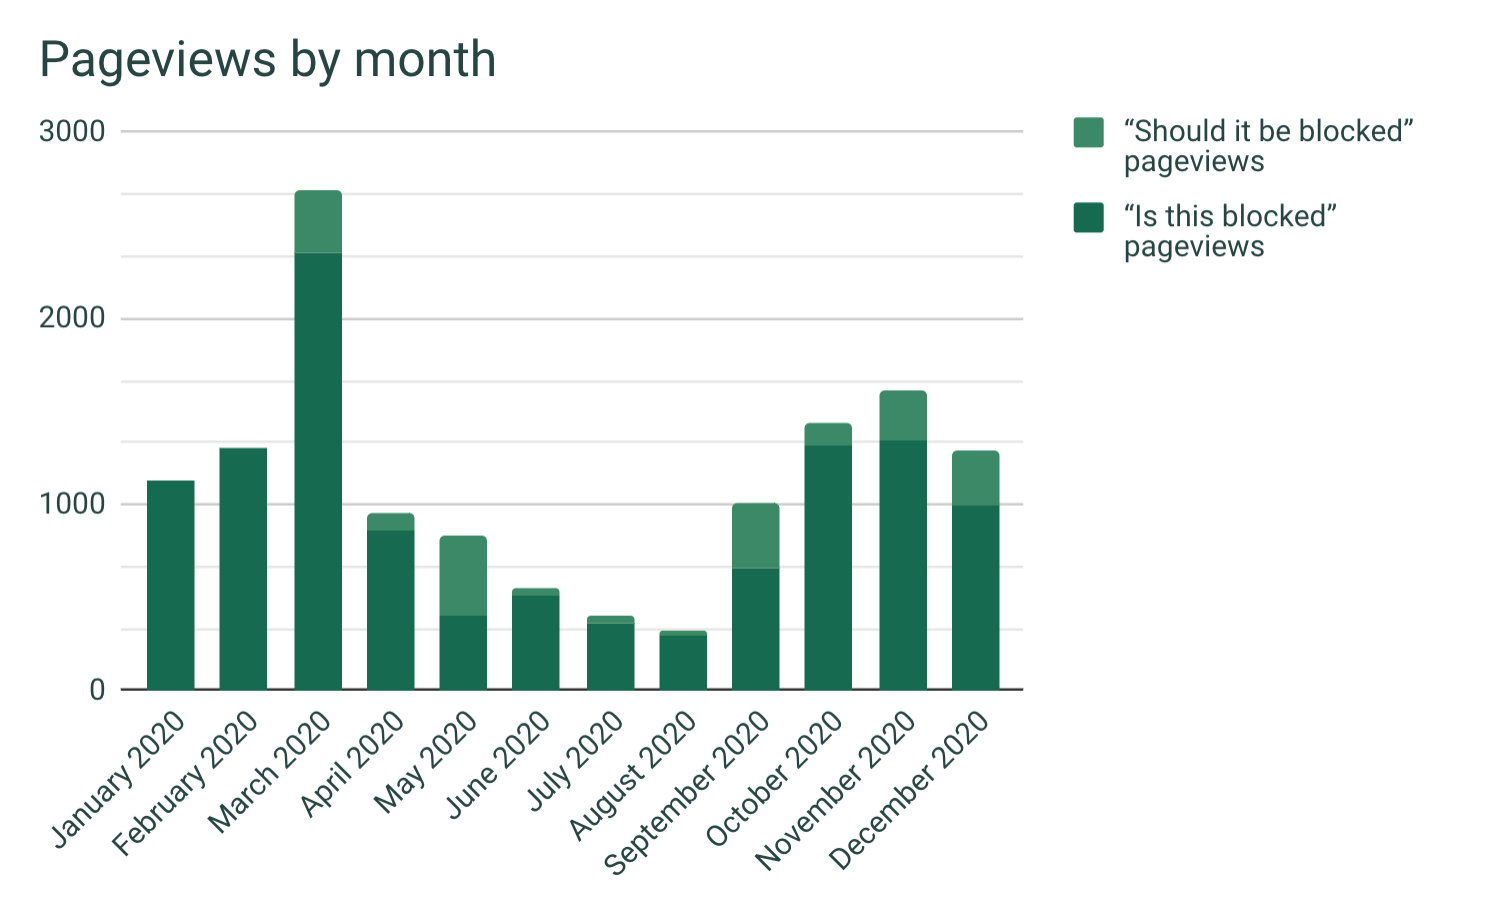
Traffic by month
As you can guess, traffic to the website peaked pretty significantly in March, alongside the government’s very rapid shift to working from home. A couple weekends into March, I also built “Should it be blocked in my department?” (based on a tweet from Imraan Bashir) which elaborates a bit on why public servants should be able to access online tools, and how to make the case for them if they’re unavailable.
Traffic to both websites seems to be pretty heavily-driven by social media conversations (on Twitter, LinkedIn, and discussion platforms like GCcollab).
Submissions by month
People can make suggestions to Is this blocked using one of four different Google Forms, depending on what kind of information they’re providing:
- Department-wide updates
To suggest changes for more than one service within a specific department - Specific service updates
To quickly suggest changes for an individual service within a department - Add a new service
To suggest a new online service (collaboration tools, messaging platforms, etc.) to add to the dataset - Add a new department
To suggest a federal department or agency to add to the dataset
In 2020, crowd-sourced submissions also peaked in March, but they were actually significantly less frequent than in 2019 (72 entries in 2020 versus 219 entries in 2019, across all four Google Forms).
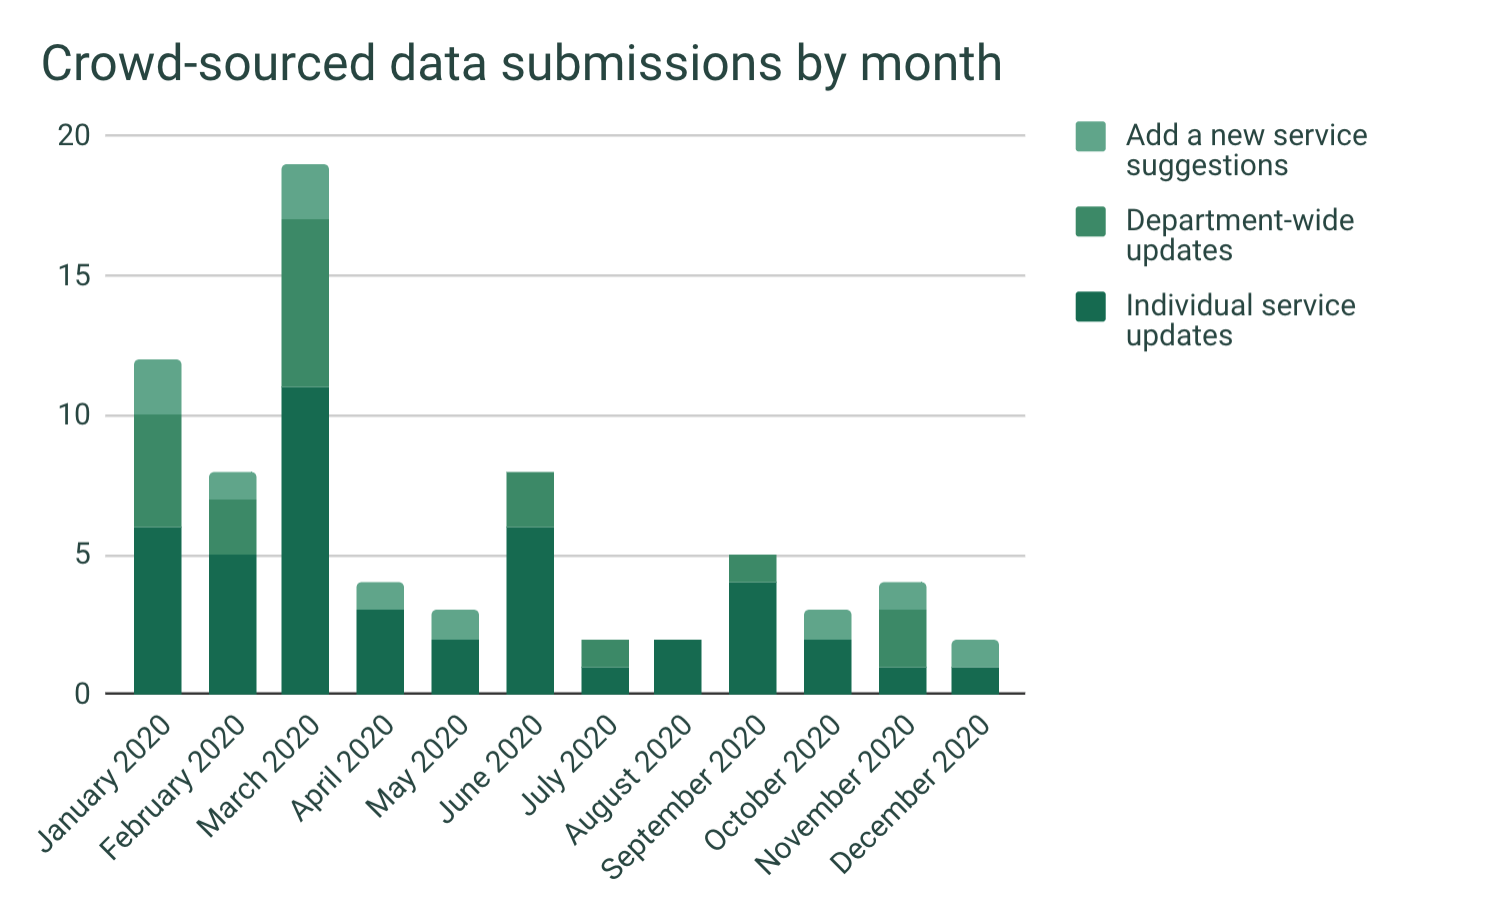
In 2020, there weren’t any submissions to the “Add a new department” form.
(It’s worth noting that – because data is anonymously submitted, and because I can’t double-check submissions by, for example, testing them on computers and networks in any department except the one I work for – there isn’t any kind of validation on the crowd-sourced submissions. So far I haven’t seen anything that looks like a deliberate attempt to skew departments’ results, which is nice! I manually update the website’s dataset based on the responses to these forms.)
Submissions by department
Based on the same form data, here’s the top 20 departments by number of crowd-sourced submissions:
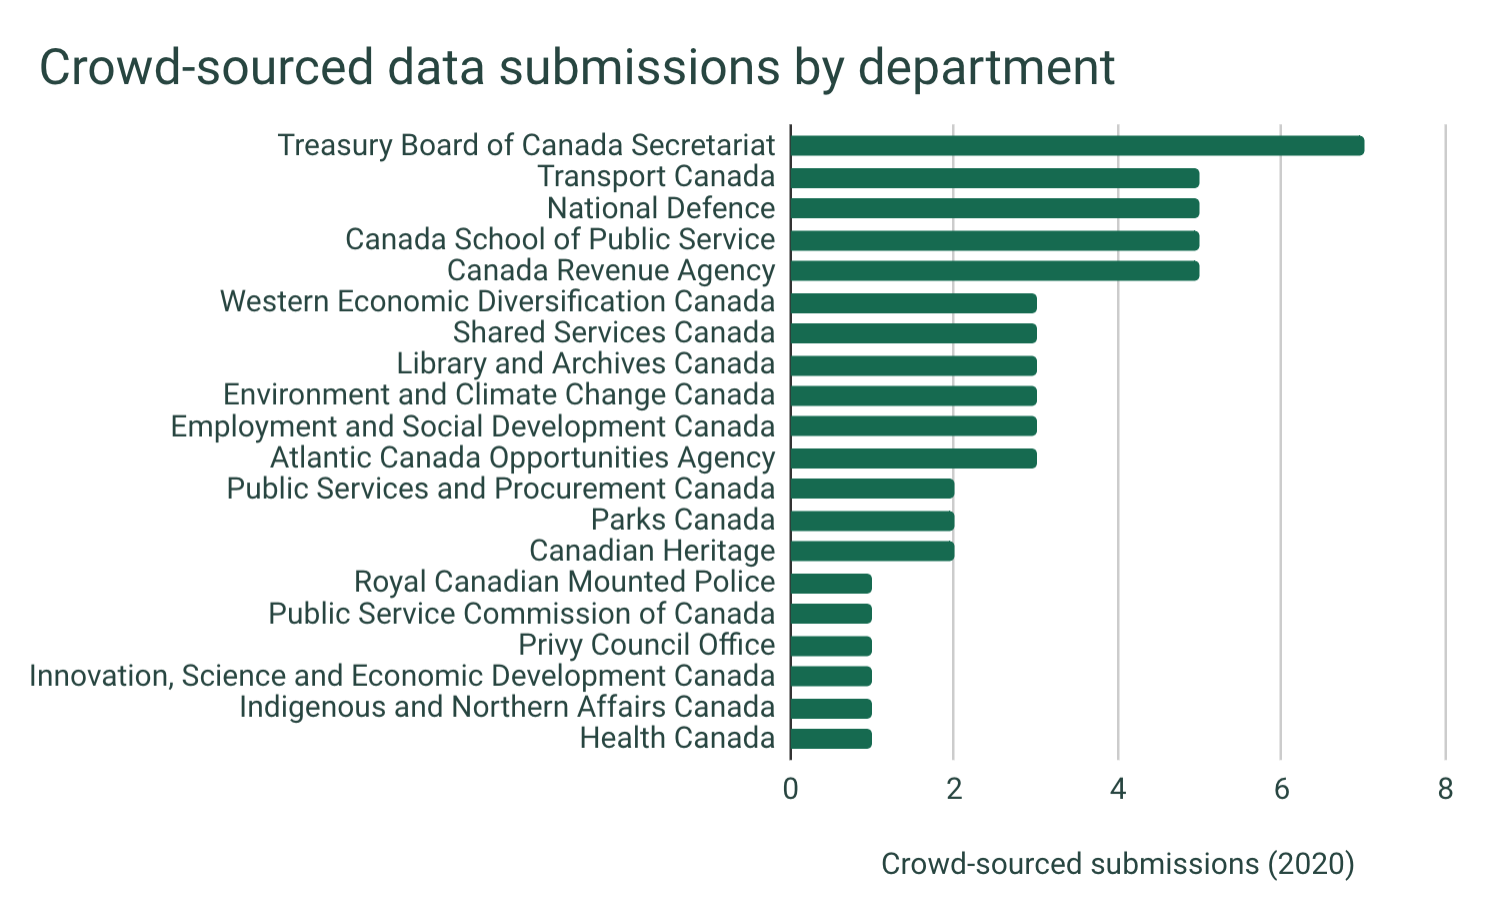
This is based on submissions to both the “Department-wide updates” and “Individual service updates” forms.
Highest- and lowest-scoring departments
Based on the current dataset (at the end of 2020), here’s the top 5 and bottom 5 departments and agencies, based on their overall score. A few new services were added this year (bringing the total from 35 to 38), which brings the highest possible score – open access to every service in the list – from 105 to 114.
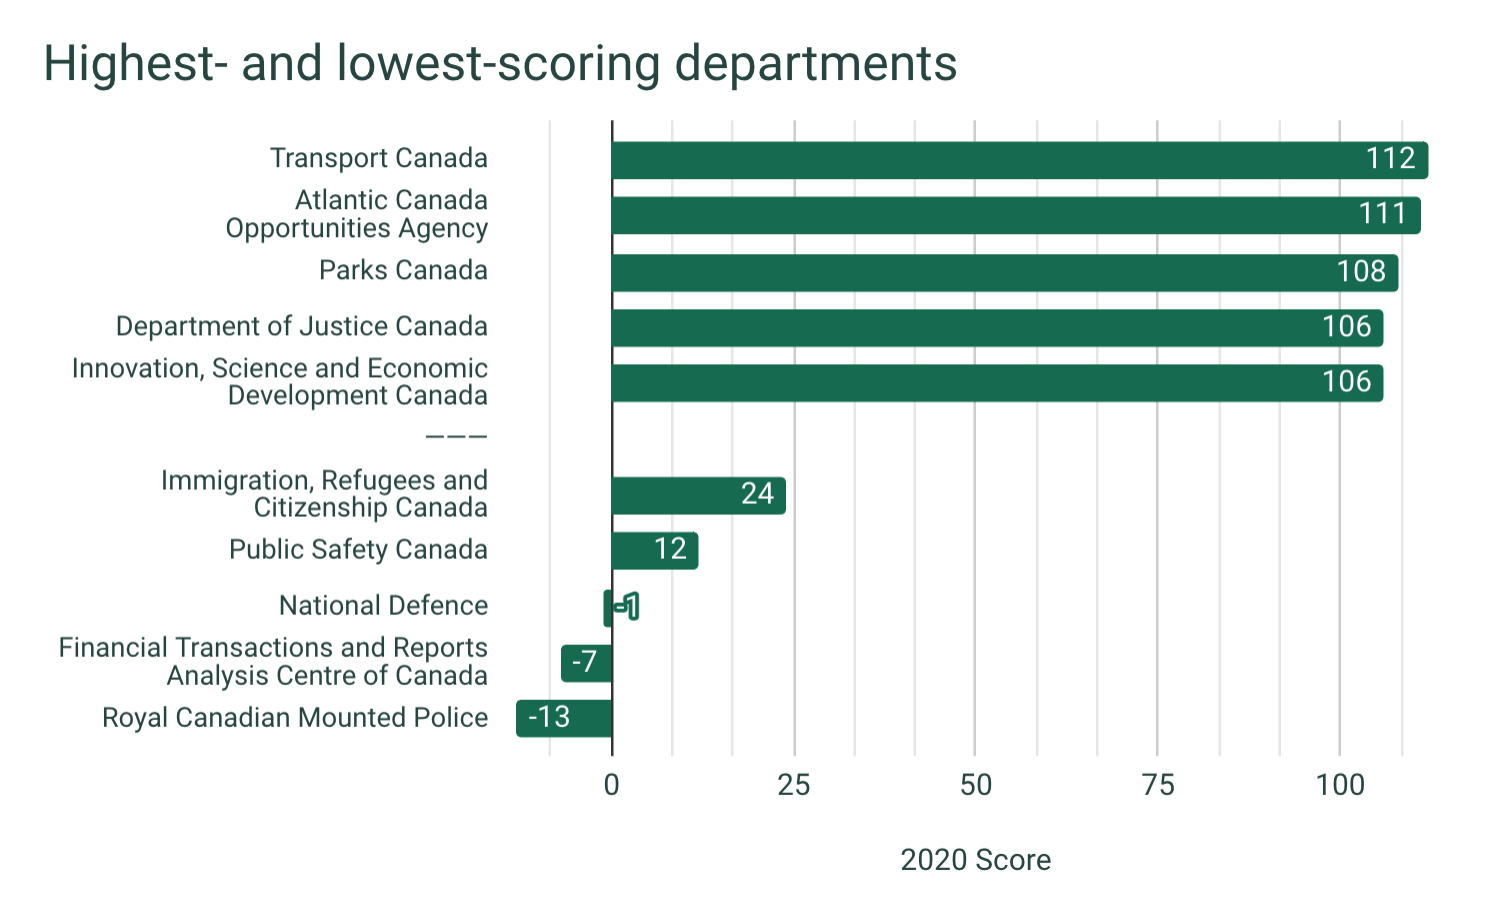
The five highest-scoring departments above (Transport Canada, Atlantic Canada Opportunities Agency, Parks Canada, Department of Justice, and Innovation, Science, and Economic Development Canada) are also the only five departments with a score above 103, which is 90% of the highest possible score.
The scoring system is a bit arbitrary, but it was designed to avoid penalizing departments that were simply missing data when the site first launched. You can sort departments by highest and lowest score on the Is this blocked homepage.
Most- and least-improved departments
One aspect I’ve been really interested to see is which departments improve the most, regardless of their starting point last year. Any progress departments make (opening up even a single service that was previously blocked) is something to celebrate.
The departments below are the five most-improved and five least-improved departments; the number overlaid on each row is the positive or negative score change between the dataset a year ago and now. (Specifically, between the Dec. 31, 2019 update and the most recent update from Dec. 8, 2020.)
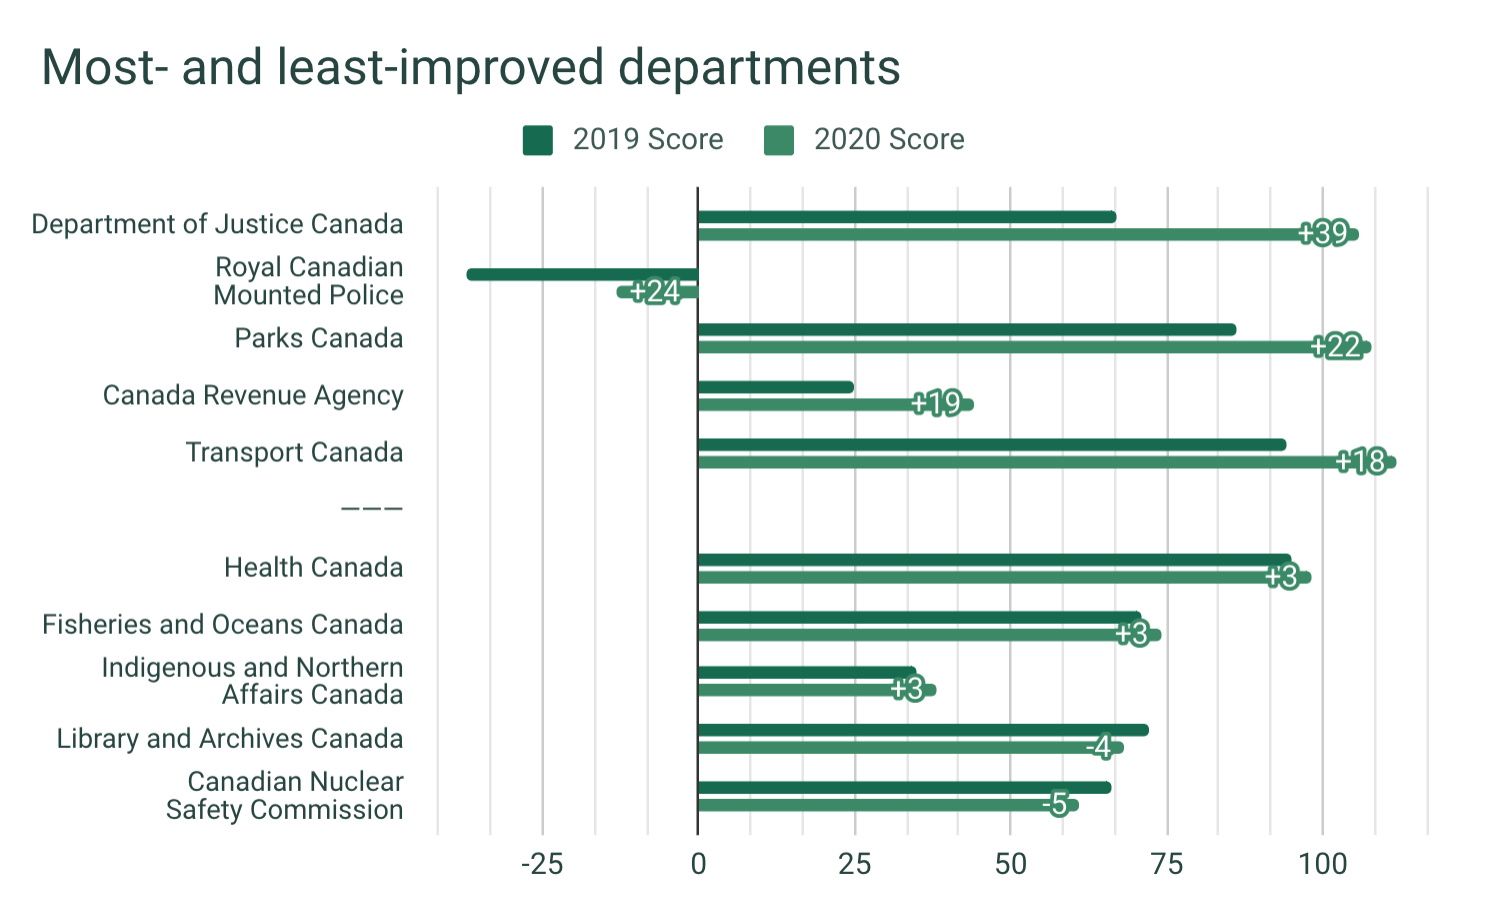
This chart excludes departments that didn’t have any data in 2019, and departments that didn’t have any new updates submitted in 2020.
Only two departments “went backwards” (blocking more services in 2020 than in 2019); Library and Archives Canada and the Canadian Nuclear Safety Commission. Despite the Royal Canadian Mounted Police’s low overall score, it improved substantially between 2019 and now.
In each of these cases, whether this represents new firewall rules being introduced or changed, or just new crowd-sourced submissions that make the data more accurately reflect what was already in place, can’t be determined from the crowd-source submissions.
What’s next?
Unlike other past civic tech projects (putting the Internet Red Tape Reduction report online, analyzing Government of Canada contract spending, or building the Meeting Cost Calculator), Is this blocked is a continually-growing and evolving website. In 2021, I hope it keeps on being useful to people as they communicate and collaborate with public servants in other departments, and as they think about which departments they’d want to work at next.
Is this blocked is only as useful as the data that’s on it; if you see any errors or missing entries on the site, please send in your suggestions! You can also see how the website is built by visiting the GitHub repository for the project.
Have a great 2021 and stay safe out there!